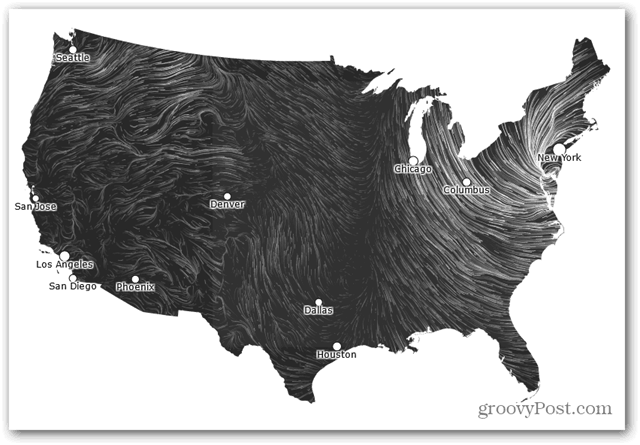
Their site takes real surface wind data from the National Digital Forecast Database and creates a real-time visualization of the data. Although originally created as a personal art project by Fernanda and Martin (who currently lead Google’s “Big Picture” data visualization group in Cambridge, MA) I’ve found it a groovy way to visualize the progress of Hurricane Sandy across the east coast. Oh, and it doesn’t hurt that the data is quite beautiful as well!
I played with it this afternoon few minutes and made a quick screencast for groovyPost TV to show how it works and a few of the features. Enjoy!
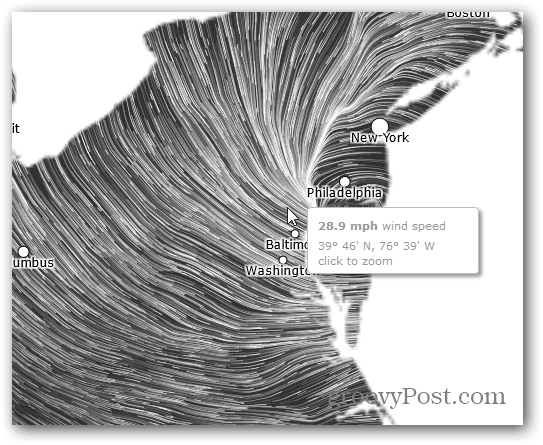
How high did the winds get? Wind speeds were up to 85 mph gusts, with sustained speeds at roughly 55 mph from 2pm to 1am. Rather than being uprooted, most trees were literally ripped in half and are still standing (although a lot shorter). Power is still out and we have an UNKNOWN estimated time of restoration. Yeah… So far our power company claims to have restored 142,349 customers’ power since last night, leaving only 6,517 still in the dark, I guess we’re just last on the priority list. Comment Name * Email *
Δ Save my name and email and send me emails as new comments are made to this post.

![]()
